


The Bay of Fundy in Maine has the highest tidal range in the world.
If you paddle in the Puget Sound for long enough without understanding and paying attention to the tides, then you will eventually end up looking longingly at your truck from across a giant, impenetrable mudflat. Maybe you’ve been lucky and avoided this fate so far. Understanding the tides is the difference between getting stranded and paddling home with the tides on your side.
Understanding the tides is also bound to help your fishing. Good fishermen use their knowledge of how fish react to tides to maximize their time on the water. No one wants to fight the tide coming home after a long day on the water. Tide predictions are a powerful tool for an informed sportsman.
So, how do tides work, and how can you get the information you need to make informed decision about the tide for any particular day? Let’s kick this off by going over that section on tides you may have slept through in 8th grade science class.
What are tides?
In short, tides are the result of how the moon, the sun, and the earth interact.
The major player here is the moon. The moon exerts 2.2 times the gravitational pull on the earth as the sun, even though the sun is larger. This is because of how close the moon is to the earth.
The moon’s gravitational pull causes the ocean closest to the moon to be pulled towards the moon. The ocean on the far side of the earth is not nearly as affected by this pull. In turn, the center of the earth is being pulled towards the moon harder than the ocean on the far side from the moon, but less hard than the ocean closest to the moon. This uneven gravitational pull creates what’s called a tidal bulge. Add the earth’s rotation into the gravity soup and you create a tidal bulge on the opposite side of the earth from the moon.

How Stuff Works really gets into this in their video below. It’s worth the quick watch. The visuals help in understanding this concept quite a lot.
The sun works either in tandem with the moon, or against it. If the moon and the sun are both lined up, then they multiply their pull and you have a super high tide called a “spring tide.” These tides happen on a full moon or a new moon.
If the sun and the moon are at right angles to each other they dampen the gravitational pull of the other, creating a super low tide called a “neap tide.” Neap tides happen on the quarter moons.
This is why many tides and current charts include full, new and quarter moons on their calendar. If the fishing is best during a spring tide, you can pin down exactly when that is and be at the right place at the right time.
The earth and moon are constantly moving around each other. Because of these movements you get a high tide on average every 12 hours and 25 minutes. This number changes dramatically in different areas of the world based on the coastal features around you. Some areas only get one high tide a day.
If you really want to take a deep dive into the physics of all this, PBS has a great video on their channel:
READING A TIDE CHART
So, how do you know what sort of tides are in your area? A good place to start is through the National Oceanic and Atmospheric Administration’s (NOAA) website. There are many websites out there that give you a really stripped down version of what you’ll see through NOAA, and those are great for a quick reference. But if you really want to dig down into reading a tide chart, then there isn’t a better source than from the guys who collect the data.
When you get to site, navigate to the area that you are interested in exploring. Click on the nearest station. This will pull up a slew of information. You can get info about water temperature, predicted tides, and actual height in the past or at the present moment.
A few things you’ll note about the data it does pull up (we took a screenshot shown below). First, the times are marked in the military time 24-hour clock. This means 0:00 is midnight, 12:00 is noon, and 22:00 is 10:00 pm.
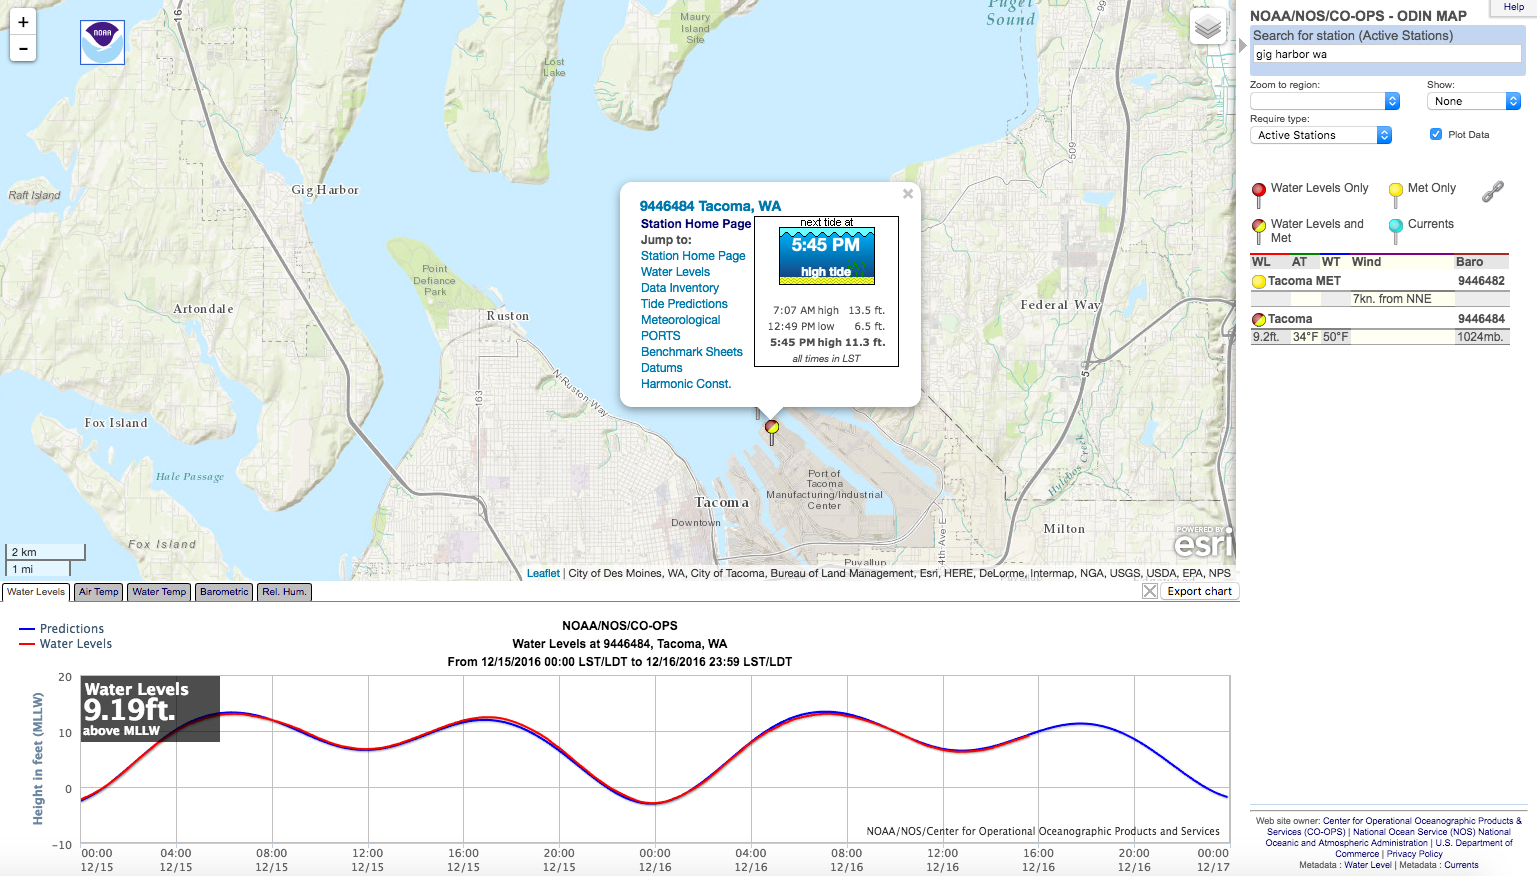
The chart from NOAA.
When we pulled up the data to write this blog post, the water level was at 9.19 ft above MLLW. The NOAA uses “Mean Lower Low Water” (MLLW) as the baseline for their graphs. MLLW is a type of datum that uses the average height of the lowest tide recorded at a tide station. Depending where you are in the world, there may be different types of datum used. Here’s a guide to all the types used world wide, so you can plan that fishing trip on the other side of the world.
In this area of the world (Gig Harbor, WA), the charts you read will likely be in MLLW. Because MLLW is an average of the heights of the lowest tide, you will often see low tides listed as a negative number.
For instance, the low tide for 12/15/16 at 0:00 was -2.251ft. The high tide at 6:20 was 13.313ft. That means that from low to high tide, there was a tidal change of 15.564 feet. That’s a pretty big difference in six and half hours. If you had paddled up to a beach at midnight, dragged the boat up a dozen yards onto the beach, and fallen asleep without anchoring the boat down with a pretty long anchor line, you could easily have woken up six hours later to a missing boat.
This basic system is used in many of the website or hardcopy charts and graphs you will find. Many folks use mobile apps to track the tides and currents. A few other popular websites our staff uses are Pro Tides and Saltwater Tides. A few app suggestions are the AyeTides App or the My Tide Times App, although there are hundreds of apps and mobile ready websites to help you make informed choices. Visit a few websites, download a few apps, and see which platform gives you the access to information you need in a way that works for you.
